Prep a new dataset for visualization
Vizualizing data with Amazon QuickSight
Amazon Quicksight is not currently compatible with the Lake Formation permissions model, so we will load a new dataset into our Data Lake, and then create a visualization for that data set using QuickSight.
Loading the new dataset into the data lake
Download the 500K Sample Sales record CSV ZIP data to your laptop from this link.
Note that other datasets of varying sizes are available from this source. For this lab please use the link above to download the 500k sample dataset, but for more information on these datasets refer to the following link: http://eforexcel.com/wp/downloads-18-sample-csv-files-data-sets-for-testing-sales/)
Unzip the file on your laptop
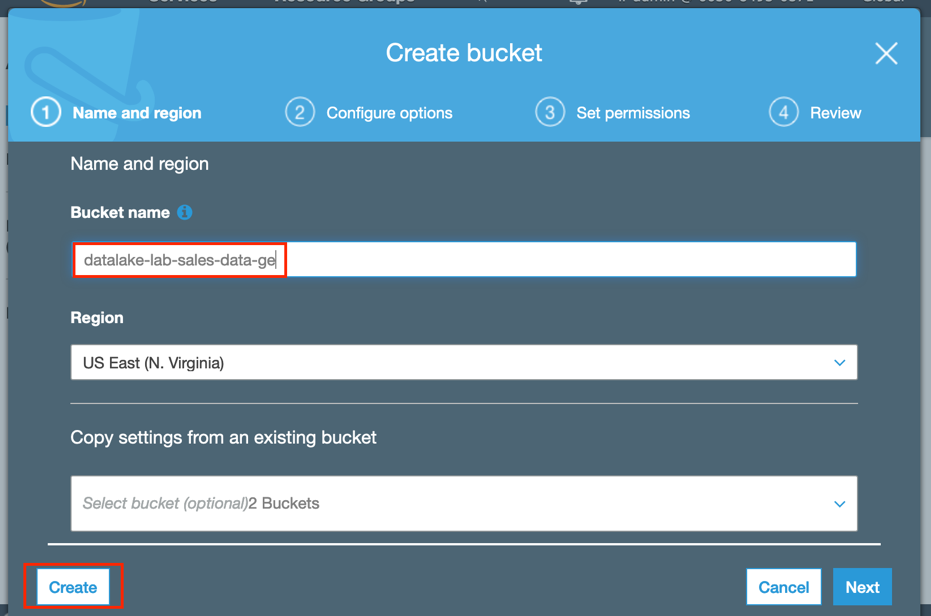
Navigate to the Amazon S3 service in the AWS management console. Click Create bucket and enter a unique bucket name, such as datalake-lab-sales-data-<your_initials>, then click Create at the bottom-left
Navigate into the bucket, and then click on Create folder. Name the folder
sales_recordsand click Save.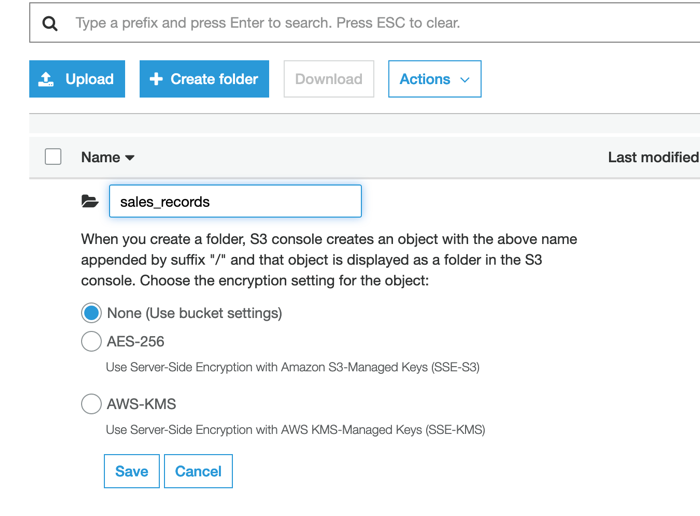
Click the sales_records folder name to go into the folder and then click Upload
Click Add files and select the unzipped CSV sales data files you downloaded in Step 1 and then click Upload. Wait for the upload to complete before continuing.
We now create a Glue crawler, which will examine the files we just uploaded, infer their schema, and create a table in the Glue catalog for our sales records. Go to the AWS Glue console, select Crawlers on the left-hand side menu, and then Add Crawler.
Provide a name for the crawler (such as
sales-record-sample-crawler), click Next, and specify the “source type” as “Data Stores” then click Next.Select the S3 bucket name and folder that we created earlier as the S3 Include path (specify to the folder level, not the filename – such as s3://datalake-lab-sales-data-your_initials/sales_records) and click Next. On the next screen leave Add another data store as No and click Next
Select the option for Create an IAM role and specify a suffix for the role name (such as
datalake-lab-sales-role), then click NextOn the next screen, select Run on demand for Frequency
On Configure the crawler’s output, click on Add database. Name the database
sales-data, and click Create. Then click on Next.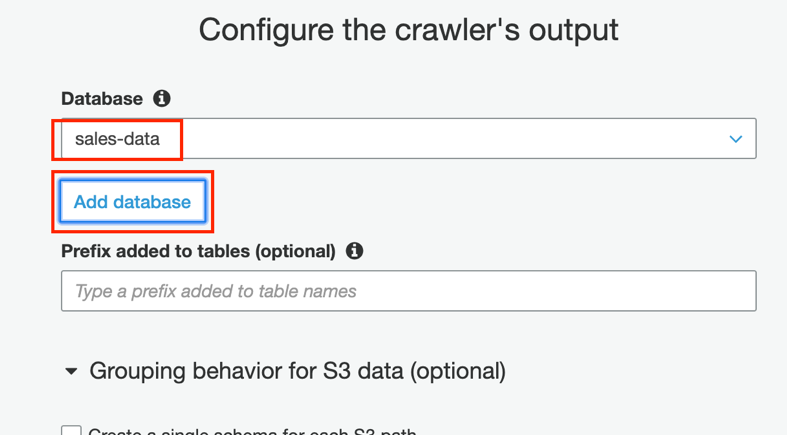
On the final screen, review and then click Finish
When you see the message indicating the crawler was created, click Run it now option, which will show status change (Starting -> Stopping -> Ready) as the crawler progresses
When the crawler completes (goes into Stopping state), it will have created a new table in the Glue / Lake Formation Catalog (sales_records)
Configure Lake Formation permissions for the new table and query with Athena
Confirm that the special permission IAMAllowedPrincipals is set on the newly created database and table. This setting allows all users with IAM permissions to access the database/table, effectively passing through the Lake Formation permissions layer. We need to do this as QuickSight is not currently compatible with the Lake Formation permissions model.
Navigate in the console to the Lake Formation service, click on databases on the left-hand menu, click the selector for the sales-data database, and then click Actions / Grant.
For the IAM Users and roles scroll to the bottom of the list and under Group select IAMAllowedPrincipals. Under Database permissions ensure that Super is selected. If it is not, select Super for database permissions and then click Grant.
Find the table sales_records in the console, and repeat the same process (grant Super permissions to the IAMAllowedPrincipals group).
Navigate to the Amazon Athena service in the AWS management console and select the “sales-data” database containing the “sales_records” table.
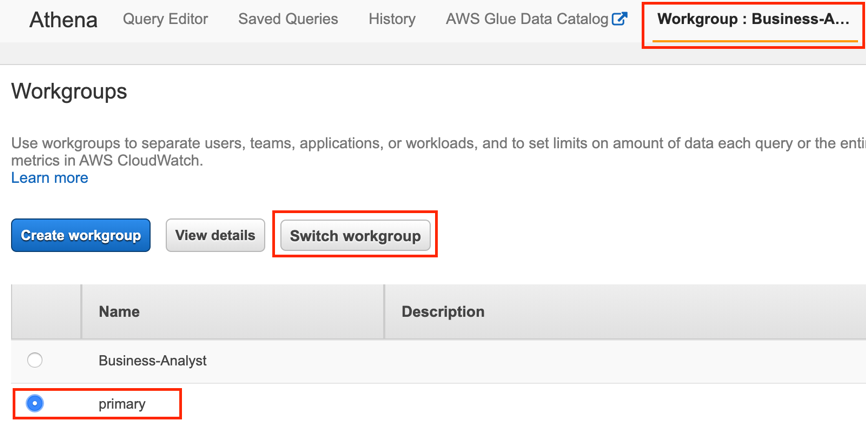
Along the top of the Athena console, if Workgroup is still set to Business-Analyst, then click on the Workgroup, select Primary from the list, and click Switch Workgroup.
In the Query Editor, run the following SQL query to get a preview of the dataset
select * from sales_records limit 100We now want to create a new summary table from the sales data which we will use for our visualizations.
The following query creates a new table (sales_channel_count) with “Sales Count” per “Region”, “Country” and “Sales Channel”, on top of which we can create our visualizations. Run the following SQL statement in the Query Editor:
CREATE TABLE sales_channel_count AS
SELECT region, country, "sales channel" as sales_channel, count("sales channel") as sales_count
FROM sales_records
GROUP BY region, country, "sales channel"
ORDER BY region, country, sales_count DESC
When the query completes, you should see a new sales_channel_count table on the left hand side of the Athena console. If this step fails make sure you are not running the query in the Business Analyst workgroup.